"Hey, where does *REAL* land value 'LIVE' in Kendall County Texas?"
With the added conditional:
"And don't give me those appraisal 'compares' -- they are just made up by some guy at tax office."
The actual question was bit more complex -- yet basically boiled down to the above question and conditional.
KEY PURSUIT -- This "real" value question drills down almost to the core mission of this blog: "How do we know -- what we think we know!" This posting will tickle the edges for key insights.
KEY PURSUIT -- This "real" value question drills down almost to the core mission of this blog: "How do we know -- what we think we know!" This posting will tickle the edges for key insights.
Mission Probable:
Buying the Desired Answer?
SALES vs TAX APPRAISAL -- It is true that most property tax appraisal districts "make up" some -- but not all -- of the property values. Recent and past "actual" sales are also used to help determine changes of property "value." The key difference? And this was buried in my client's question -- how to DISTINGUISH "real" sales values from "made up" values for tax appraisal purposes. Was there a method to pull these different kinds of value apart for examination?
'MARK TO MARKET' PROBLEM -- Sales Trends vs Long Term Holdings and "Pollution" of values.
To be more fair to tax appraisal districts -- consider the long term value trend identification issue: For some properties -- that remain in the same hands for 10 / 20 / 40 years -- and fail to manifest a "real market price" -- via a realized market sale -- and in order to collect "fair and balanced" tax values -- tax appraisal districts must "guess" the property value for taxes -- roughly every year.
While the guess (estimation) process is heavily vetted and subject to many rules -- and in most tax jurisdictions attempts to be "fair" and "reasonable" -- the estimation process can be biased -- either accidentally -- thru blunders or poor attention to details -- or for more mischievous reasons (for revenue / political influence). "Vet" and "Zen" of "real" property value verses price Skullduggery can be tricky to identify -- when just looking at one to 10 lots in the field. Sometime larger patterns can be "seen" when a few 1000 parcels are compared -- via one possibe approach -- outlined below.
Skullduggery? Yes, who can "out-guess" the official "guesser" for a property "value?" Whether the "guesser" is "official" or "consultant" -- the raw tax data routinely fails to identify the guesser's orientation -- and the bias factors will change from year-to-year -- and decade-to-decade. A "price bias" -- either high or low -- can remain in the data for many years.
LAST SALE OVER-RIDE -- Some county GIS tax databases *do* flag "real" sales vs some other valuation process -- and will sometimes report a "last sale" date -- presumably to trigger some "superior" valuation process -- like "Hey, this tax value is too old -- we need an updated estimate for next year's appraisal."
However -- not all county tax GIS-databases retain "last sale" information -- and if retained -- there are no guarantees the "last sale" dates are realistic or were maintained in a careful manner. Plus an adjoiner sale value -- *NOW* -- will often influence or over-ride any past considerations. Experience with tax appraisal databases from AK / PA / LA / ND / NM / TX / and others -- indicate "last sale" maintenance -- and tax value significance -- varies much from county-to-county -- and state-to-state (much seems to depend on local tax jurisdiction policies, "personality," data absorption and appraisal skills).
UPSHOT? REAL GOAL? -- My client wanted to DIFFERENTIATE between a "real sale price" -- verses -- systemic valuation bias (i.e. county wide guesses) in the reported property values. My client wanted the "data behind the data" to aid his investment search.
RAW DATA and QUICKLOOK -- GIS data was obtained from a public source for Kendall county Texas (KCAD Data). The data was "fresh" and up to date -- in the sense that a very dedicated and skilled GIS camper had brought the KCAD tax data -- and the parcel data -- up to good digital standard.
Review of the data -- and "testing" on an "example" sub-division -- produced an interesting 1st cut surprise. Maps and details to anchor the eyeballs and brain for "Alamo Springs"
Review of the data -- and "testing" on an "example" sub-division -- produced an interesting 1st cut surprise. Maps and details to anchor the eyeballs and brain for "Alamo Springs"
2004 Kendall County TX Parcel Map
and Location of Alamo Springs in Green
(click for larger)
And a Log-Log Plot of the raw ACRES (x-axis) -- verses -- "Sale or Tax Value" (y-axis) yielded an interesting scatter plot pattern:
Log-Log Value Chart
Acres (x) vs Sale or Tax Value (y)
Green Dots: Alamos Springs Parcels
(click for larger)
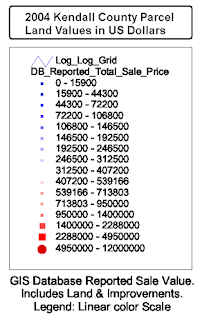
Dot Value-vs-Color Legend
1ST BRUSH SIGNIFICANCE -- The clustering of Alamo Springs sub-division parcels (green dots) along the X-axis was no surprise -- in year 2004 -- the sub-division "lots" were roughly between 2 and 15 acres.
The clustering in dollar value -- along the Y-axis -- was more interesting -- especially when "compared" to other parcel valuations across the county (blue to red dots): The lot values were scatter clustered between $10k and $100k -- and were "stabbed" by a lower-left to upper-right linear clustering line pattern.
This linear clustering pattern was found -- via stats and regression analysis -- to generally be along a trend line of approx $7000 per acre. Rough descriptive trend equation was found to be of the form:
Value (dollars) = $7000 x Acres(-0.98)
Where the exponent of Acres -- the value "-0.98" -- is very close to "-1.00" -- and where a negative 1.0 exponent means "per acre."
Other trend lines -- above and below -- were also expressed -- and numerically explored. These trend line scatter patterns suggested some "hidden hand" in the property market was "setting" land value vs acres in some deliberate and mathematically deterministic way. My client wanted to know: Was this trend line from tax appraisal estimated values? Or a "real" market "signal" in sale prices? A trend that could be leveraged for better "buy in" decisions.
DOTS with ID -- Each of the Log-Log scatter plot dots were "addressable" -- and each dot had a "link back" to the original parcel data attributes -- parcel ID number, landowner name, last sale date, land acres, improvements, etc.
VALUE SPACE QUERY FOR REAL SPACE LOCATION -- In short -- and this is the key point of this posting -- dots on the Log-Log value chart could be interrogated in Log-Log space -- and the significance of their map geo-location -- if any -- could be determined. Basically a rapid technique for flipping back and forth between "comparables" -- in terms of land value -- to map location -- and noting any significant acre-vs-value patterns.
1st TEST -- SMALL ACRES, MEDIUM VALUE Compares -- My client wanted to examine small acreages -- usually highly developed and in urbanized "towns" -- verses -- the much more ranch-land rural parts of Kendall county. Some more surprise -- a Value-vs-Acres selection -- in the Log-Log chart space -- like thus:
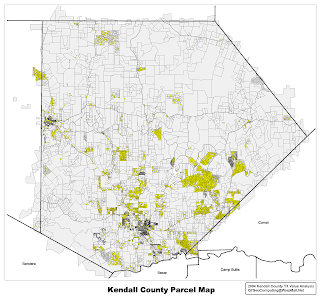
MANIFEST IN THE "MAP SPACE" -- This blob selection "Lit Up" the Kendall county parcel map -- in yellow -- thus:
INTERESTING POINT -- The Log-Log selection blob "found" parcels -- on the map -- that were generally in urban and "developed" areas. Lots located in the towns of Boerne and Comfort Texas.
2nd TEST - LARGER ACRES, MEDIUM VALUE Compares -- Searching for a "Bargain" property. A second "Blob" selection in the Log-Log value space "found" Kendall parcels in very different map locations:
IN THE "MAP SPACE" -- This 2nd blob selection "Lit Up" the Kendall county parcel map -- in yellow -- for larger sub-division areas -- outside the "town" areas:
MYSTERY COMPARES -- Significant Outliers -- In the Log-Log value space plots: There were other, more mysterious "offset" points -- out near the edges. The best example called out in the charts: the Benedictine Sisters Orphanage located on the former Kronkosky property -- a significant outlier with a very large valuation: Approx $19.6 million for some 40 acres -- $488,400 per acre in 2004. This large valuation would make NO fiscal sense for a private landowner -- as the taxes would be out of proportion for offset "comparables." However -- since the orphanage is a charity -- and probably tax exempt -- there would be no tax bill.
Negotiation Leverage? One possible interpretation for this significant outlier? Sharing this example with various appraisal experts -- the speculation? This large valuation is used to self-report and to establish a trend: In the event the orphanage is forced to sell -- eminent domain or related for public space, road or utility corridor -- or chooses to sub-divide and sell a lot or two -- the orphanage negotiators can begin with a very high price history -- and appear price flexible -- as the negotiations unfold.
SUMMARY -- The above Log-Log value space analysis has been repeated for Bexar County Texas -- a county with approx 600,000 parcels -- with some surprisingly similar results -- and some unique differences. Because Bexar county is "more urban" -- and more "mixed use" than Kendall county -- Value space chart patterns are very different for Bexar county -- and exhibit many "localized" value personalities. Stay tuned for a future example.
The clustering in dollar value -- along the Y-axis -- was more interesting -- especially when "compared" to other parcel valuations across the county (blue to red dots): The lot values were scatter clustered between $10k and $100k -- and were "stabbed" by a lower-left to upper-right linear clustering line pattern.
This linear clustering pattern was found -- via stats and regression analysis -- to generally be along a trend line of approx $7000 per acre. Rough descriptive trend equation was found to be of the form:
Value (dollars) = $7000 x Acres(-0.98)
Where the exponent of Acres -- the value "-0.98" -- is very close to "-1.00" -- and where a negative 1.0 exponent means "per acre."
Other trend lines -- above and below -- were also expressed -- and numerically explored. These trend line scatter patterns suggested some "hidden hand" in the property market was "setting" land value vs acres in some deliberate and mathematically deterministic way. My client wanted to know: Was this trend line from tax appraisal estimated values? Or a "real" market "signal" in sale prices? A trend that could be leveraged for better "buy in" decisions.
DOTS with ID -- Each of the Log-Log scatter plot dots were "addressable" -- and each dot had a "link back" to the original parcel data attributes -- parcel ID number, landowner name, last sale date, land acres, improvements, etc.
VALUE SPACE QUERY FOR REAL SPACE LOCATION -- In short -- and this is the key point of this posting -- dots on the Log-Log value chart could be interrogated in Log-Log space -- and the significance of their map geo-location -- if any -- could be determined. Basically a rapid technique for flipping back and forth between "comparables" -- in terms of land value -- to map location -- and noting any significant acre-vs-value patterns.
1st TEST -- SMALL ACRES, MEDIUM VALUE Compares -- My client wanted to examine small acreages -- usually highly developed and in urbanized "towns" -- verses -- the much more ranch-land rural parts of Kendall county. Some more surprise -- a Value-vs-Acres selection -- in the Log-Log chart space -- like thus:
Chart: "Value" Selection in Dollars
vs Acres in Log-Log Scatter Cluster Space
(click for larger)
MANIFEST IN THE "MAP SPACE" -- This blob selection "Lit Up" the Kendall county parcel map -- in yellow -- thus:
Kendall County Map: Parcel Selection by
1st "Blob Query" in Log-Log Value Space
(click for larger)
INTERESTING POINT -- The Log-Log selection blob "found" parcels -- on the map -- that were generally in urban and "developed" areas. Lots located in the towns of Boerne and Comfort Texas.
2nd TEST - LARGER ACRES, MEDIUM VALUE Compares -- Searching for a "Bargain" property. A second "Blob" selection in the Log-Log value space "found" Kendall parcels in very different map locations:
Chart: "Value" Selection in Dollars
vs Acres in Log-Log Scatter Cluster Space
(click for larger)
IN THE "MAP SPACE" -- This 2nd blob selection "Lit Up" the Kendall county parcel map -- in yellow -- for larger sub-division areas -- outside the "town" areas:
Kendall County Map: Parcel Selection by
2nd "Blob Query" in Log-Log Value Space
(click for larger)
MYSTERY COMPARES -- Significant Outliers -- In the Log-Log value space plots: There were other, more mysterious "offset" points -- out near the edges. The best example called out in the charts: the Benedictine Sisters Orphanage located on the former Kronkosky property -- a significant outlier with a very large valuation: Approx $19.6 million for some 40 acres -- $488,400 per acre in 2004. This large valuation would make NO fiscal sense for a private landowner -- as the taxes would be out of proportion for offset "comparables." However -- since the orphanage is a charity -- and probably tax exempt -- there would be no tax bill.
Negotiation Leverage? One possible interpretation for this significant outlier? Sharing this example with various appraisal experts -- the speculation? This large valuation is used to self-report and to establish a trend: In the event the orphanage is forced to sell -- eminent domain or related for public space, road or utility corridor -- or chooses to sub-divide and sell a lot or two -- the orphanage negotiators can begin with a very high price history -- and appear price flexible -- as the negotiations unfold.
SUMMARY -- The above Log-Log value space analysis has been repeated for Bexar County Texas -- a county with approx 600,000 parcels -- with some surprisingly similar results -- and some unique differences. Because Bexar county is "more urban" -- and more "mixed use" than Kendall county -- Value space chart patterns are very different for Bexar county -- and exhibit many "localized" value personalities. Stay tuned for a future example.


